Table of Contents
This chapter describes how to search for information about JEUS MBeans and view various statistics using WebAdmin.
MBean information can be searched using WebAdmin and a console tool (jeusadmin).
In WebAdmin, MBean information is searched as follows:
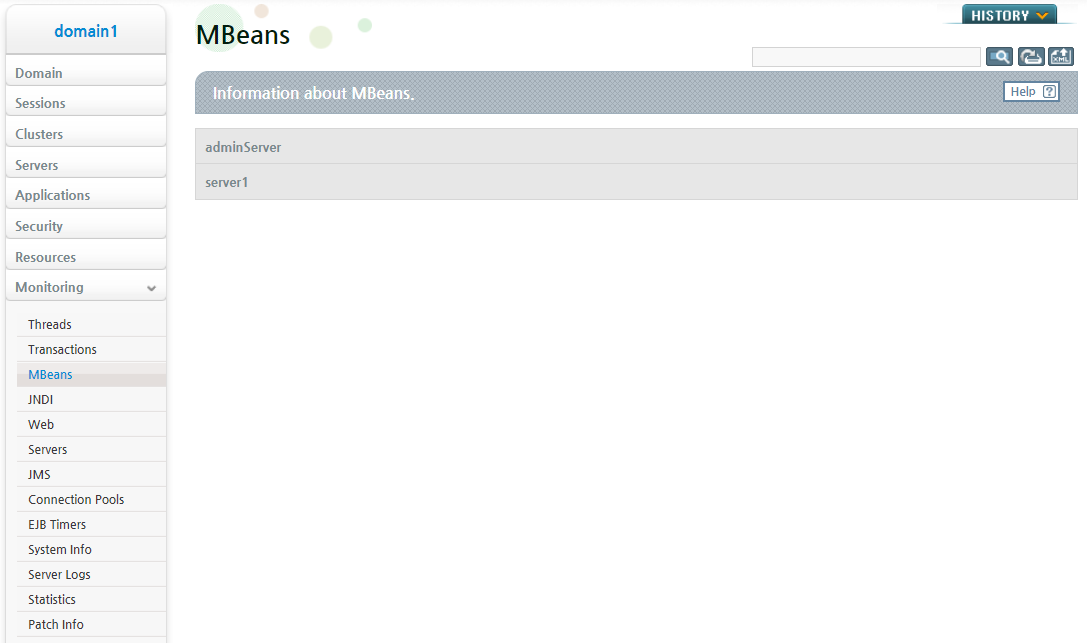
Select [Monitoring] > [MBean] from the JEUS node tree on the left part of the WebAdmin screen.
Select a server to display MBean information from the Server drop-down list.
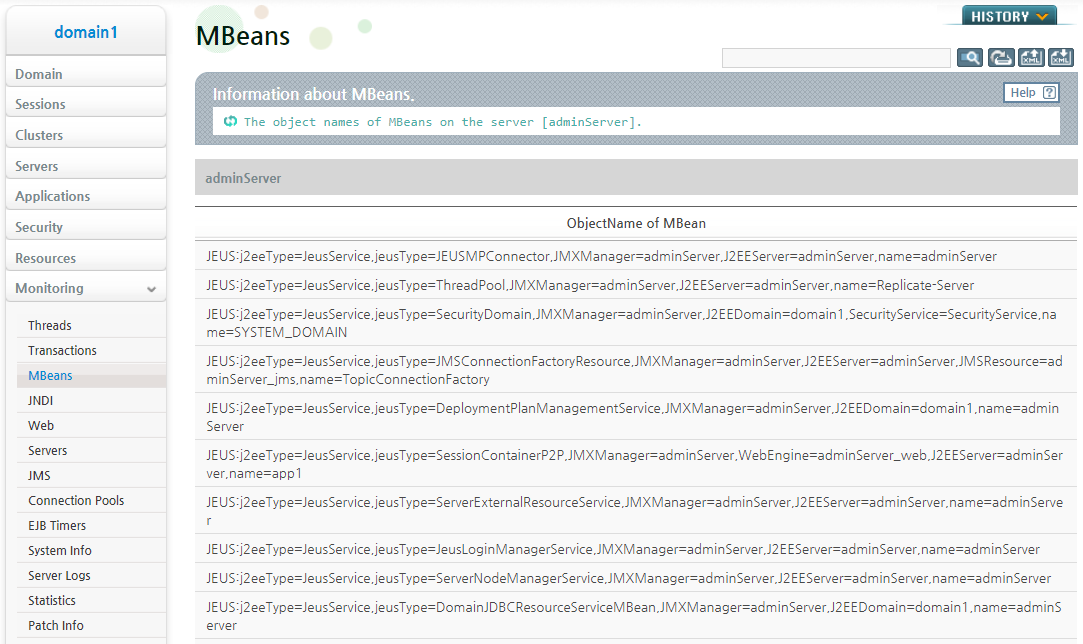
The search result will appear as follows:
MBean information can be retrieved using a console tool named 'jeusadmin'
Log on to the JEUS server using the jeusadmin tool and then run the mbean-info command. The information for the registered MBeans is displayed as follows:
[DAS]domain1.adminServer>mbean-info -server adminServer
The object names of MBeans on the server [adminServer].
================================================================================
+------------------------------------------------------------------------------+
| JEUS:j2eeType=JeusService,jeusType=ThreadPool,JMXManager=adminServer,J2EEServ|
|er=adminServer,name=threadpool.System                                         |
| JEUS:j2eeType=JeusService,jeusType=JMSDestinationResource,JMXManager=adminSer|
|ver,J2EEServer=adminServer,JMSResource=adminServer_jms,name=ExamplesQueue     |
| JEUS:j2eeType=JeusService,jeusType=JEUSMPConnector,JMXManager=adminServer,J2E|
|EServer=adminServer,name=adminServer                                          |

    . . .

| JEUS:j2eeType=JeusService,jeusType=JNDIResourceService,JMXManager=adminServer|
|,J2EEServer=adminServer,name=adminServer                                      |
| JEUS:j2eeType=JTAResource,JMXManager=adminServer,J2EEServer=adminServer,name=|
|adminServer                                                                   |
| JEUS:j2eeType=JMSResource,JMXManager=adminServer,J2EEServer=adminServer,name=|
|adminServer_jms                                                               |
+------------------------------------------------------------------------------+
================================================================================
Statistics Monitoring provides various statistics provided by JEUS through WebAdmin.
A user can select statistics values to create a group. The user can set the group name and description and save it into a file. The group, which consists of selected statistics values, is called a Statistic Preset (hereafter Preset). This section describes how to manage the Statistic Preset.
Note
The Preset configuration is stored in the JEUS_HOME/domains/DOMAIN_NAME/config/monitoring.xml file. If the file is modified, it might generate an error, so be careful not to modify the file.
If the function does not work properly because the file has been modified or damaged, delete the monitoring.xml file. But in such case, the preconfigured presets are also deleted.
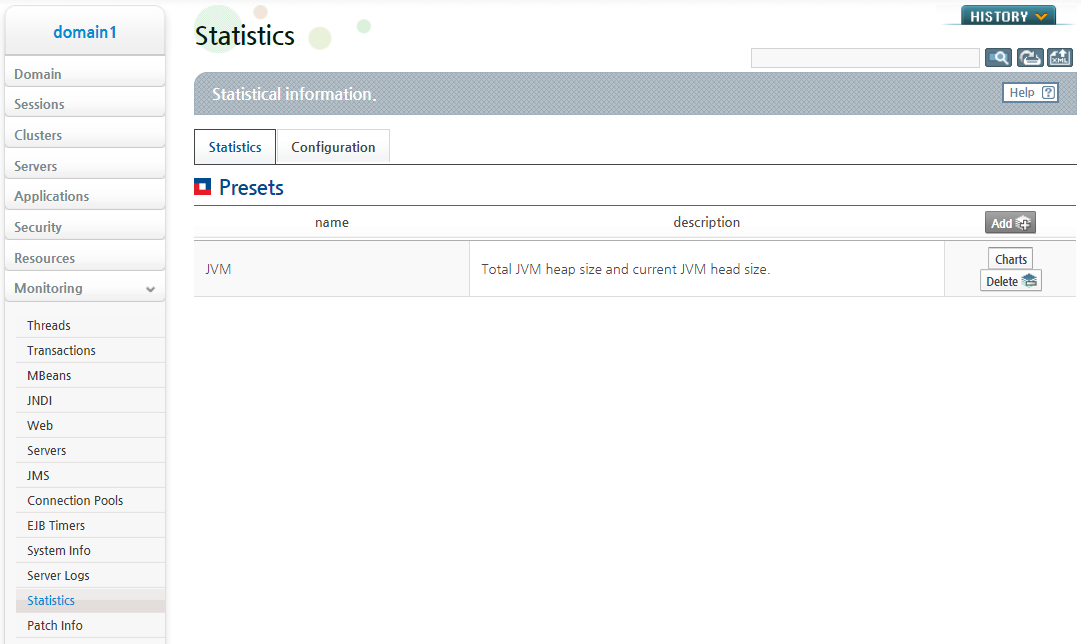
Select [Monitoring] > [Statistic] on the left of the WebAdmin screen to go to the Statistic screen.
In the [Statistic] tab, the list of Presets that are currently set are displayed. In this tab, a preset can be added, modified, or deleted, and a preset chart can be viewed. In the [Set] tab, the chart settings such as refresh cycle can be modified.
Adding/Modifying a Preset
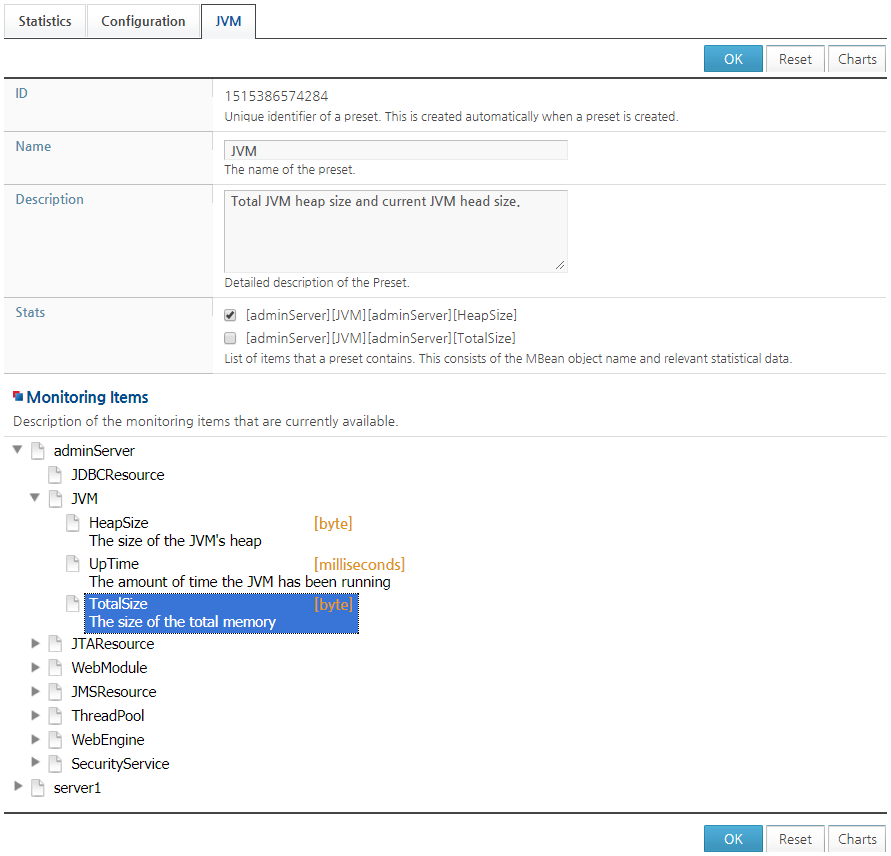
To go to the Addition/Modification screen of a preset, click the [Add] button on the Statistic screen or click a preset from the Preset list. Configure items for a Preset and click [OK] to save the Preset configuration and go to the Statistic Screen.
The following describes each field.
| Field | Description |
|---|---|
| Id | Preset identifier that is created automatically. |
| Name | Name that describes the Preset. |
| Description | Detailed description of the Preset. |
| Stats | List of statistics items of the Preset. An item can be deselected by unchecking its check box. |
| Monitoring Items | Tree of statistics items that the Preset can contain. To expand or collapse the tree, click the triangular icon next to each field icon. Name, unit, and description of statistics items are displayed for selection. If an item is clicked, it will be added to the Stats list. |
Deleting a Preset
If the [Delete] button of the Preset to delete is clicked in the Statistic screen, a confirmation message box appears. Click [OK] in the window to delete the Preset.
Select the [Set] tab in the Statistic screen to configure the refresh interval for and the maximum number of items to be displayed on the chart.
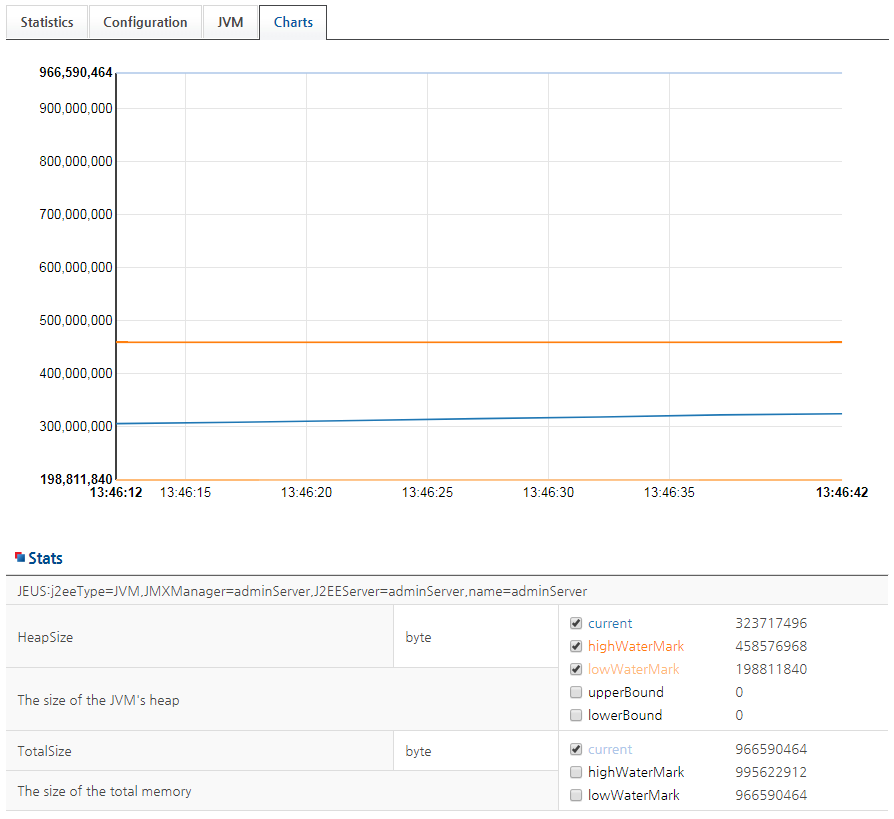
If a Preset is selected, WebAdmin displays the statistics of the Preset in a graph. The current state and trend of the statistics can be easily discerned in the chart.
If [chart] is selected from the Preset list in the Statistic screen, the page navigates to the Chart screen.
The Chart screen consists of the following areas.
-
Chart area
Graph of the values selected from the Stats area.
-
Stats area
List of statistics items in the chart and the list of values provided by each statistics item. There is a check box to the left of each value. Each value can be added to or deleted from the chart by checking or unchecking the check box.
