Table of Contents
This chapter describes main features of the [TOPOLOGY] menu in the project detailed mode.
You can select the way of displaying topology on the screen.
-
In the project detailed mode, go to the [TOPOLOGY] menu.

-
Select the type of topology view in the navigation bar at the bottom of the screen.

The navigation bar provides the following buttons.
-
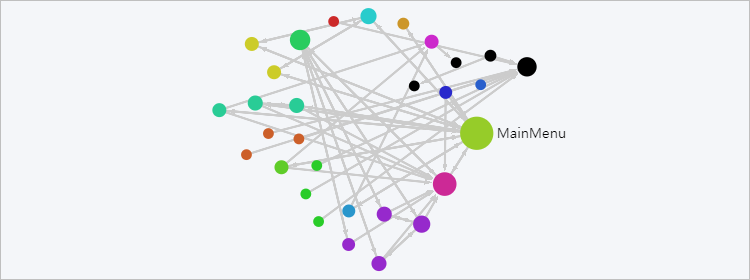
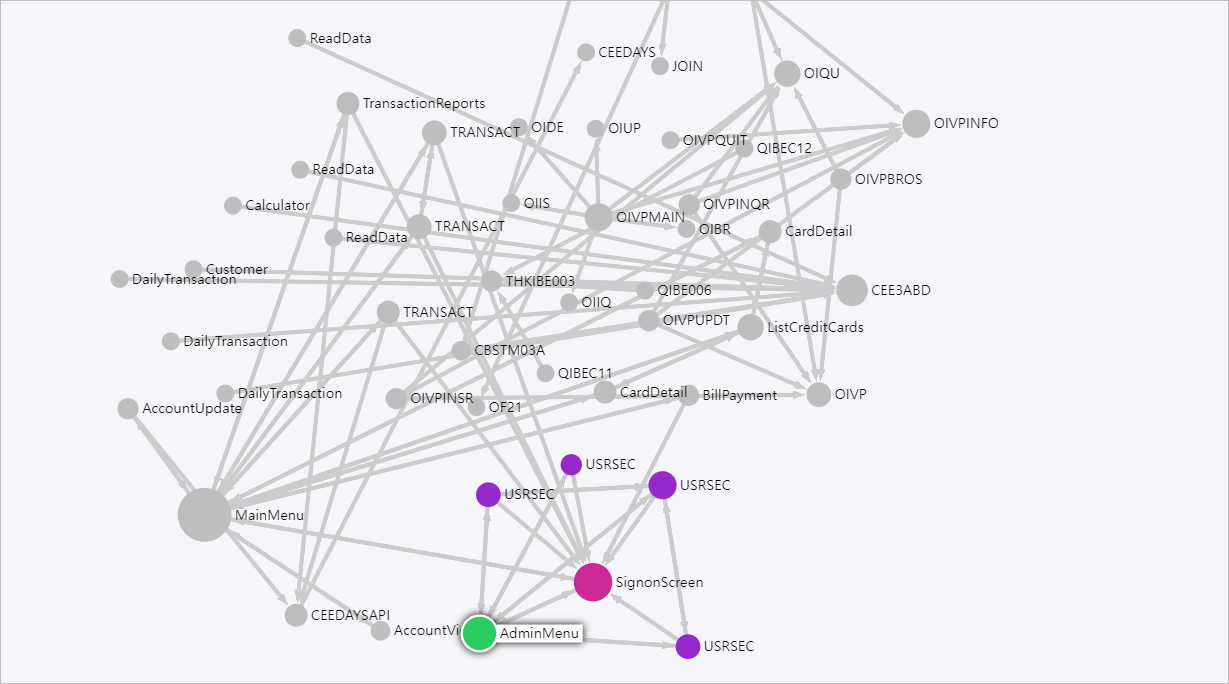
Displays the basic type of topology representing the relationships between assets.
Each circle in the topology represents a single asset, and the arrows between the circles shows the call relationships between assets. The more calling/called assets for a specific asset, the larger the size of circles.
When hovering the mouse over a circle, it highlights the assets that directly calls or are called by the asset. Clicking the circle displays only the assets directly calling or being called by the selected asset on the screen.
-
Displays the tree-type topology representing assets based on their call depth.
Each circle in the topology represents a single asset, and the arrows between the circles shows the call relationships between assets.
When hovering the mouse over a circle, it highlights the assets that directly calls or are called by the asset. Clicking the circle displays only the assets directly calling or being called by the selected asset on the screen.
-
Displays the list of assets in the project in a table.
The following describes each item of the table.
Item Description Name
Name of the asset.
Asset Type
Type in which the asset has been analyzed.
Logical Name
Logical name of the asset.
Domain
Domain to which the asset belongs.
Group
Group to which the asset belongs.
Node Description
A brief description of the asset.
-
Switches to the full-screen mode of Topology and Tree views.
-
Aligns the Topology and Tree to the center of the screen.
-


You can search for specific assets. However, it is only available in the 'Topology', 'Tree', and 'full-screen' views.
-
In the project detailed mode, go to the [TOPOLOGY] menu.
-
Click
 icon on the left of the Topology page to expand the search pane.
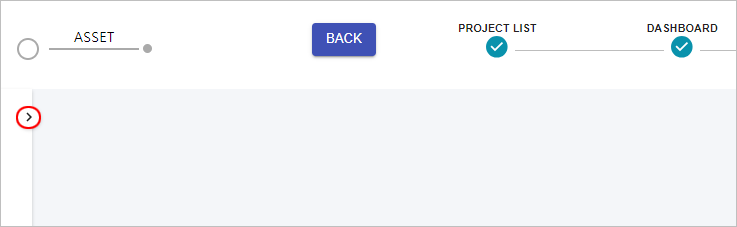
-
Enter the name (or logical name) of the asset in the search field.
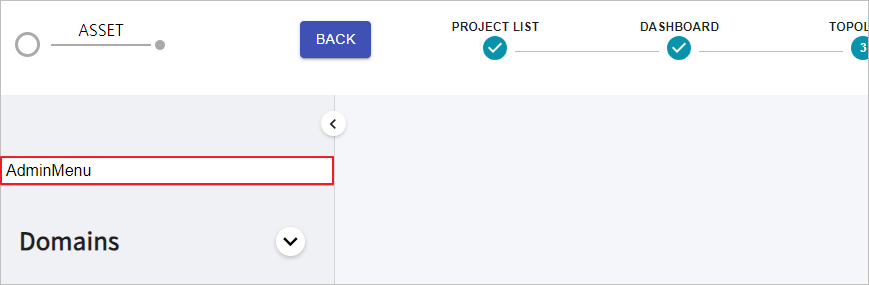
-
The corresponding asset is displayed in the center of the screen.
You can register and manage metadata for assets. The registered data will be utilized in analysis.
-
In the project detailed mode, go to the [TOPOLOGY] menu.
-
Click
 icon in the expanded search pane to expand the Domains section.
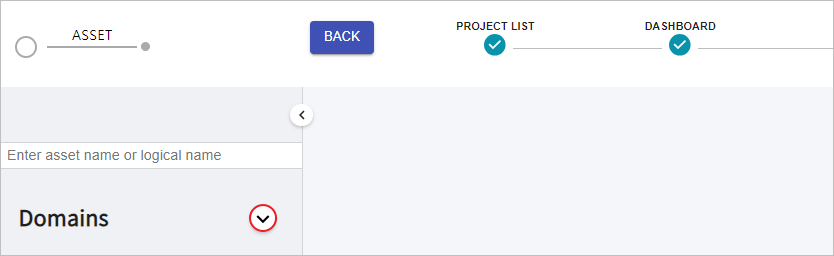
-
In the Domains section, click the [Metadata] button.

-
When the Metadata dialog box appears, you can manage metadata.

The Metadata dialog box provides the following buttons.
Button Description Registers new metadata for a single asset.
For more information about registration method, refer to "9.3.1. Adding Metadata".
Deletes the registered metadata.
For detailed information about how to delete metadata, refer to "9.3.2. Deleting Metadata".
Removes the existing metadata and registers the metadata based on the content of Excel file created by the user.
For detailed instructions for the upload method, refer to "9.3.3. Uploading Excel Files".
Downloads the currently registered metadata as an Excel file.
You can enter metadata for a single asset.
-
Click the [Add] button in the Metadata dialog box .
-
When the Add dialog box opens, you can set the basic information.

The following describes each item.
Item Description Type
Select a COBOL component for which you want to add metadata.
-
Program
-
Section
-
Paragraph
Program Name
Enter the name of the COBOL program for which you want to add metadata.
Program Type
Enter the behavior of the COBOL program. (Applicable only to 'Program' type)
Function Name
Enter the name of the section or paragraph in COBOL. (Applicable only to 'Section' or 'Paragraph' type)
Logical Name
Enter the logical name that matches the COBOL program.
When a logical name is set, the asset name is indicated as that logical name in the topology.
Domain
Enter the unit of application to which the COBOL program belongs. (Applicable only to 'Program' type)
When a domain is set, it is displayed in the color assigned to that domain in the topology.
Domain Group
Enter the parent group of the application to which the COBOL program belongs. (Applicable only to 'Program' type)
Description
Enter a brief information about the metadata.
-
-
After completing the settings, click the [Add] button.
You can delete the registered metadata.
In the Metadata dialog box, select the checkbox of the metadata you want to delete in the list, and then click [Delete] button.

You can remove the existing metadata and configure analysis metadata based on the uploaded Excel file.
-
Create metadata in an Excel file.

The following describes each column.
Column Description Type
Enter a COBOL component for which you want to add metadata.
-
Program
-
Section
-
Paragraph
Program Name
Enter the Name of the COBOL program for which you want to add metadata.
Program type
Enter the name of the behavior of the COBOL program. (Applicable only to 'Program' type)
Function name
Enter the function name of the section or paragraph in COBOL. (Applicable only to 'Section' or 'Paragraph' type)
Logical name
Enter the logical name that matches the COBOL program.
When a logical name is set, the asset name is indicated as that logical name in the topology.
Domain
Enter the unit of application to which the COBOL program belongs. (Applicable only to 'Program' type)
Domain group
Enter the parent group of the application to which the COBOL program belongs. (Applicable only to 'Program' type)
Description
Enter a brief information about the metadata.
-
-
Click the [Upload] button in the Metadata dialog box.
-
When the file explorer appears, select the Excel file with the metadata and click [Open].
You can check the list of domains where the asset belongs to based on the registered metadata. At this time, you can choose to display or hide specific domains in the topology.
-
In the project detailed mode, go to the [TOPOLOGY] menu.
-
In the expanded left pane of the Topology screen, click
icon next to Domains to expand the Domains section. -
In the expanded Domains section, you can check the list of domains to which assets belong.
Clicking domain names can change the status of the show/hide option. A checked status (
 ) indicates the domain displayed in the topology, and an unchecked status (
 ) indicates the domain that is not displayed in the topology.
Additionally, clicking the [Select All] button at the top of the list displays all domains in the topology, while clicking [Clear All] button hides all domains in the topology.

You can check the basic information of a specific asset. However, it is only available in the 'Topology', 'Tree', and 'full-screen' views.
-
In the project detailed mode, go to the [TOPOLOGY] menu.
-
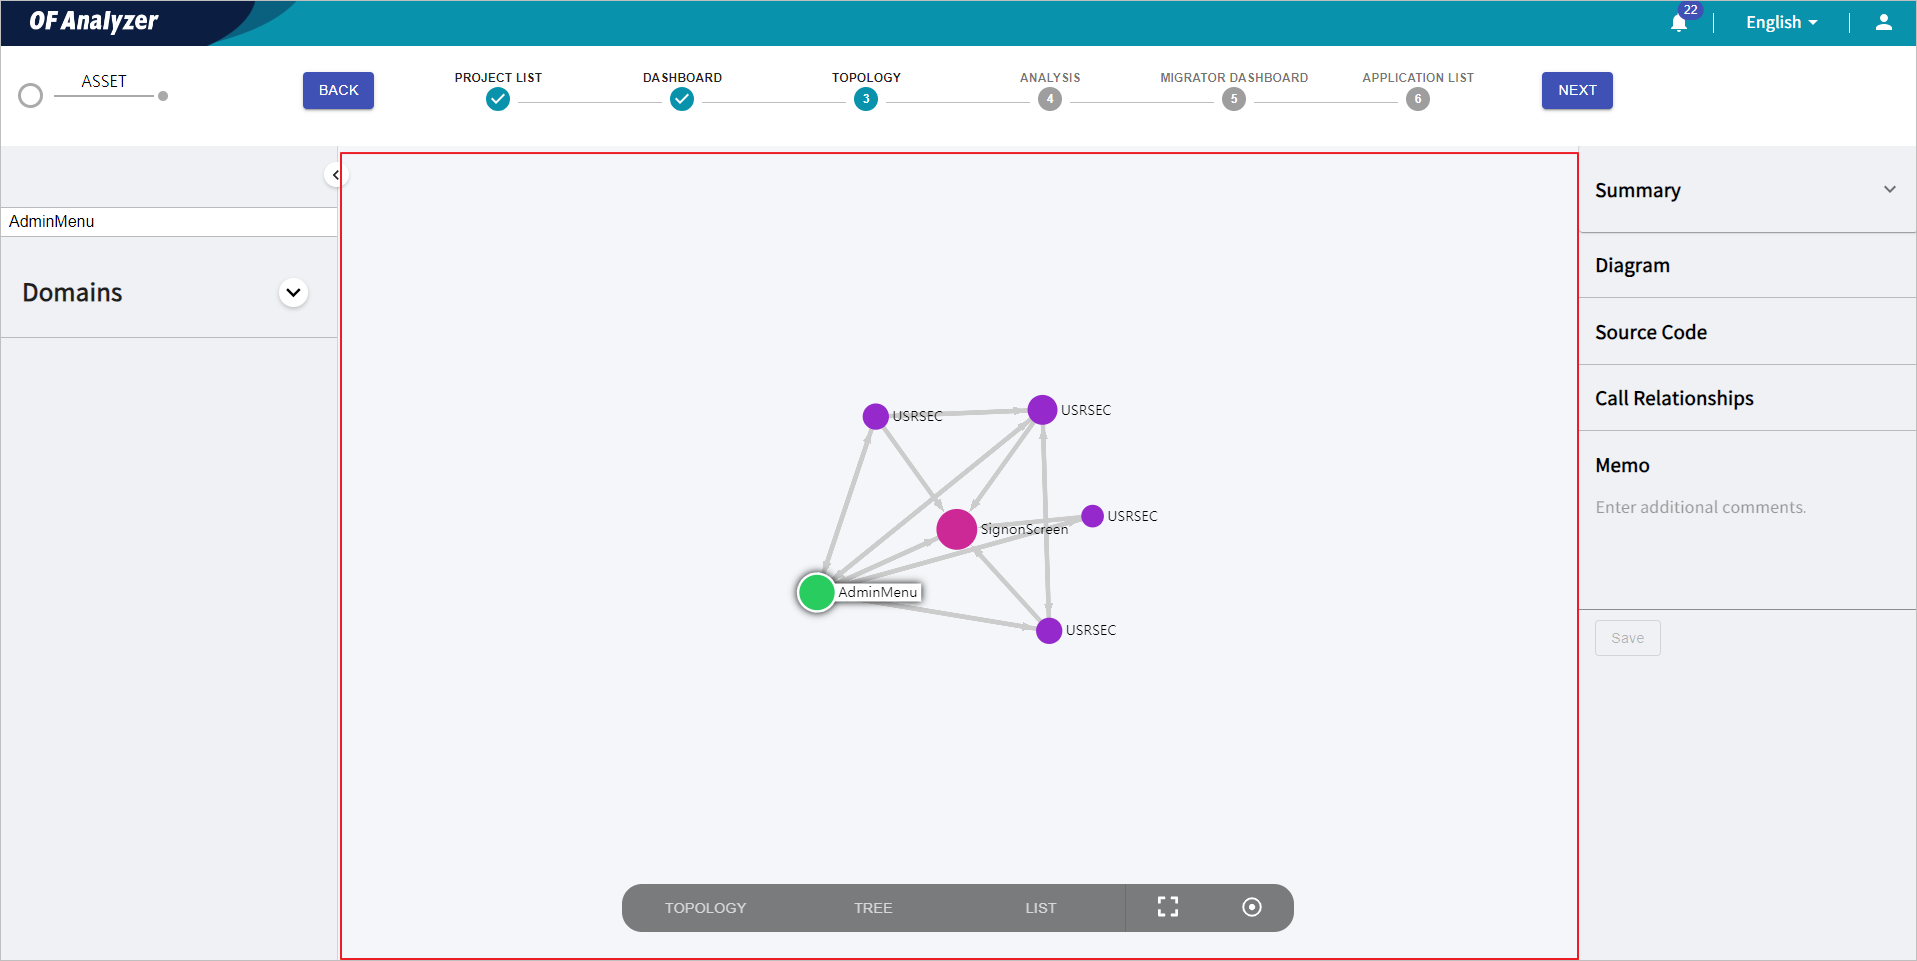
Click the asset for which you want to view information in the topology.
-
The asset information is displayed in the right pane of the screen. Clicking the Summary displays the overview of the selected asset.
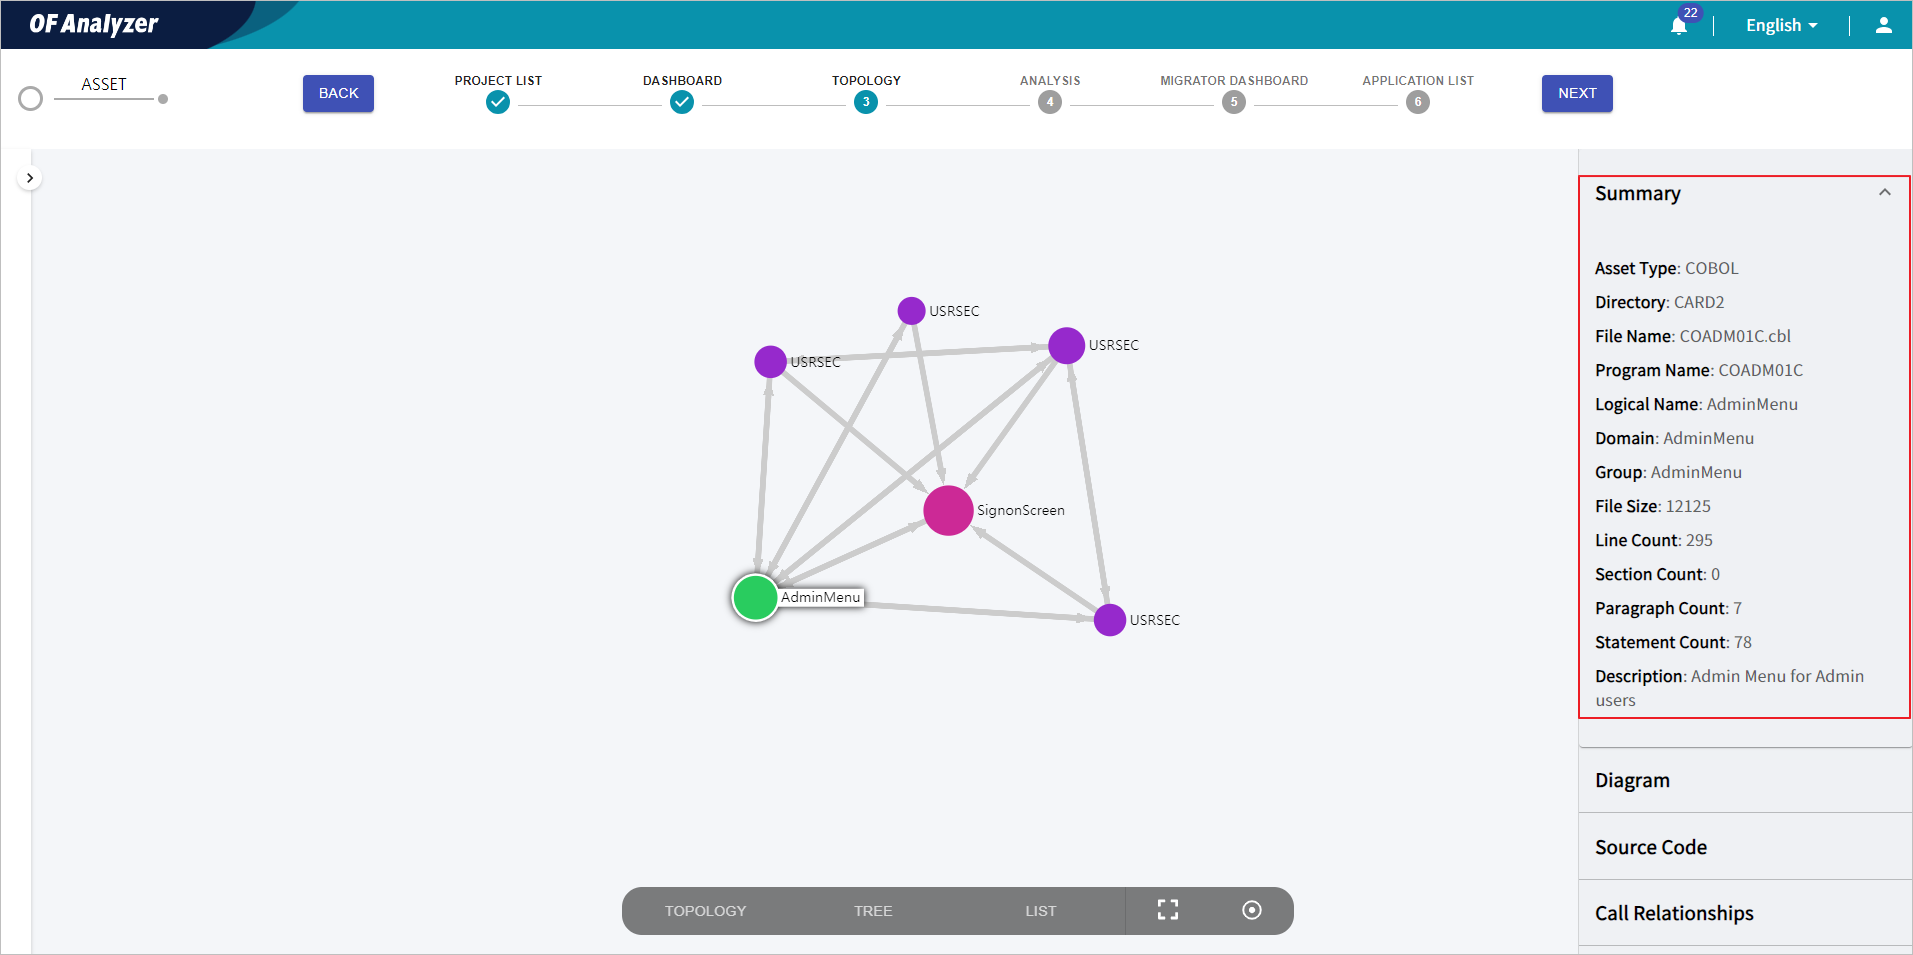
The following describes each item.
Item Description Asset Type
Type of the analyzed asset.
Directory
Directory where the asset is located.
File Name
File name of the asset.
Program Name
Name of the program.
Logical Name
Logical name of the asset.
Domain
Domain to which the asset belongs.
Group
Group to which the asset belongs.
File Size
File size of the asset.
Line Count
Number of source code lines of the asset.
Section Count
Number of sections within the program.
Paragraph Count
Number of paragraphs within the program.
Statement Count
Number of statements within the program.
Description
A brief description of the asset.
Note
For undefined assets, only the Program Name is displayed.
You can view five types of diagrams (SEQUENCE, FLOW, DOMAIN, BUSINESS, and DATA) containing various information helpful for analysis of a specific asset.
-
In the project detailed mode, go to the [TOPOLOGY] menu.
-
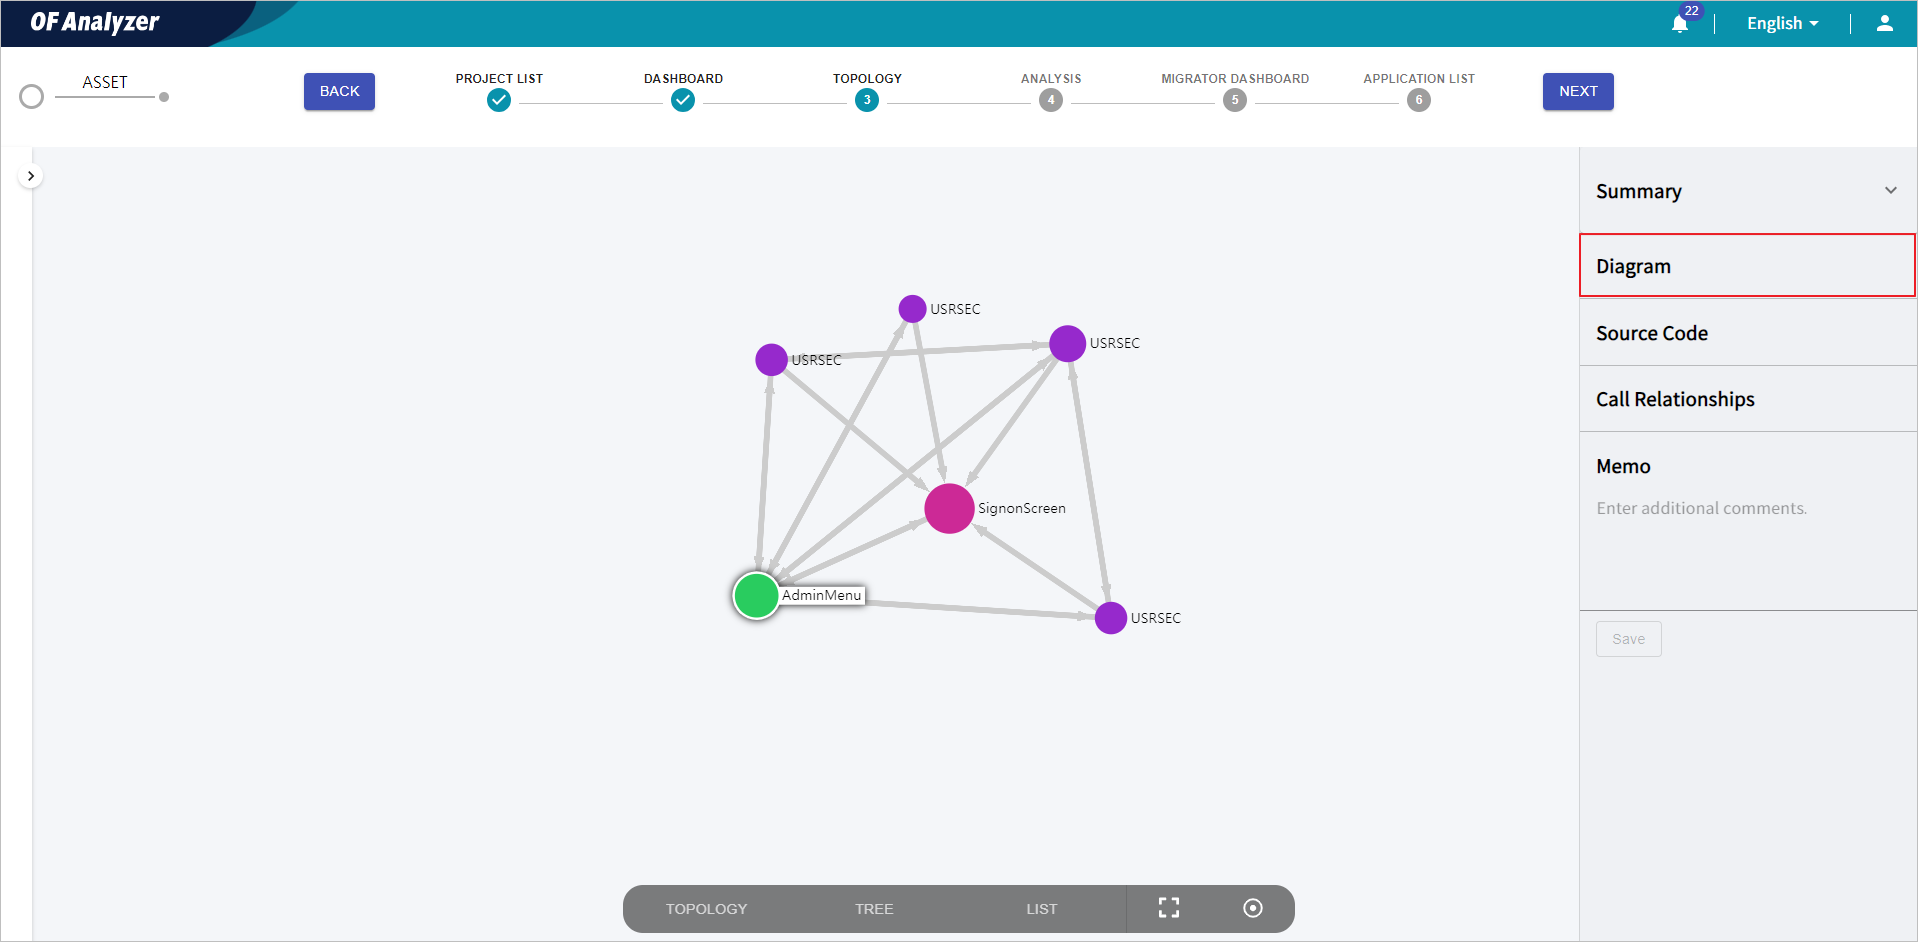
Click the asset for which you want to view the diagram in the topology.
-
The asset information is displayed in the right pane of the screen. Click the Diagram section to view diagrams.
-
When the Diagram screen opens, click the type selection buttons (①) at the top right of the screen to view each type of diagram.
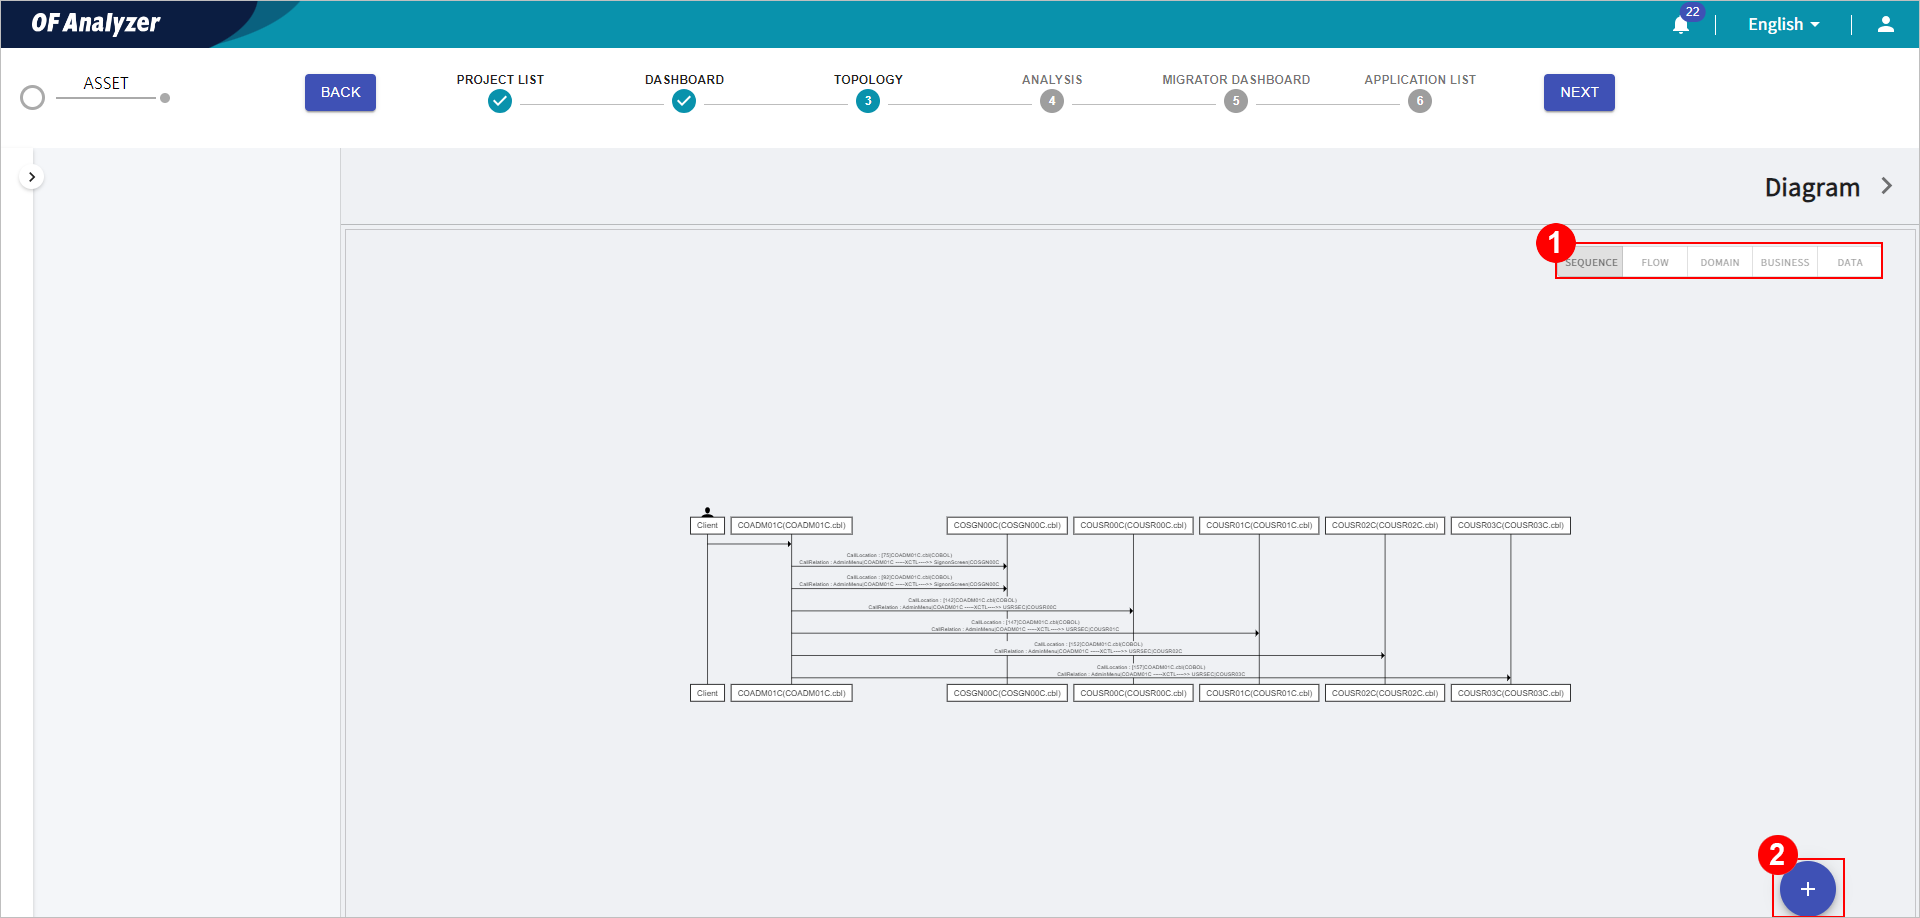
In addition, hovering the mouse over the [+] button (②) at the bottom right of the screen allows you to perform additional functions.
The following describes additional functions.
Menu Description 
Adjust the depth of the diagram. You can adjust the depth from level 1 to 10 by using the [-] and [+] buttons on the either side of the number.

Displays the source code of the asset.
If you click the part where the call is made in the 'SEQUENCE' and 'DOMAIN' diagrams, or if you click the section name in the 'DATA' diagram, the corresponding location is displayed in the source code.

Returns the diagram that is zoomed in or out to the default magnification.

Downloads the diagram as an image file.
Displays the call relationships with other assets in the sequential order starting with the selected asset.
In the first access, it shows the asset that is directly called from the selected asset (1 depth).

Note
If the metadata has been registered, the logical name is displayed to the left of the program name in the call relationships.
Displays the call relationships between assets. Unlike 'SEQUENCE' or 'DOMAIN' diagrams, this type of diagram also indicates the called assets and focuses on displaying the overall call relationships between assets such as recursive calls.

Note
If the metadata has been registered, the domain name and logical name are displayed below the program name.
Shows the call relationships between assets in the order of calls, similar to SEQUENCE type. If metadata is registered for the assets, it groups and displays them by domain according to the data.

Note
If metadata has been registered, the nodes are grouped by domain. That is, even if the calls are made between multiple assets within a single domain, only one node is displayed. Additionally, the logical name is displayed to the left of the program name in the call relationships.
Illustrates the internal logic of a single asset. You can check the flow of the program based on conditional statements and its branches.


You can view the source code of assets.
-
In the project detailed mode, go to the [TOPOLOGY] menu.
-
Click the asset for which you want to view the source code.
-
The asset information is displayed in the right pane of the screen. Click the Source Code section.

You can view the call relationships in a tree structure based on a specific asset.
-
In the project detailed mode, go to the [TOPOLOGY] menu.
-
Click the asset for which you want to view the call relationships.
-
The asset information is displayed in the right pane of the screen. Click the Call Relationships section.

-
You can check the call relationships in a tree structure based on the selected asset.

You can also perform additional functions by hovering the mouse over the [+] button at the bottom right of the screen.
The following describes additional functions.
Menu Description Adjusts the depth of call relationships.

Downloads the call relationship information of the viewed asset as an Excel file.
You can enter a brief description for the asset.
-
In the project detailed mode, go to the [TOPOLOGY] menu.
-
In the topology, click the asset for which you want to write a description.
-
The asset information is displayed in the right pane of the screen. Enter a brief description in the input field of the Memo section, and then click the [Save] button.
