Table of Contents
- 4.1. Overview
- 4.2. Session Manager
- 4.3. SQL Monitor
- 4.4. Transaction Monitor
- 4.5. Analyze Manager
- 4.6. Graph and Report
- 4.7. Parameter Manager
- 4.8. Extents Viewer
- 4.9. Database Information
- 4.10. Tablespace Manager
- 4.11. Instance Monitor
- 4.12. Compile Invalid Objects
- 4.13. Security Manager
- 4.14. Export, Import
- 4.15. ExpImp
This chapter explains the screen layouts and the usage of some functions that may be frequently used by database administrators (DBAs). As the functions explained in this chapter are the advanced features used by DBAs, they are not necessary for general users.
The following are the DBA functions provided in tbAdmin.
In addition, Export, Import, and ExpImp tools are explained in this chapter.
Session Manager allows DBA retrieve session information about the currently connected database.
To start the Session Manager, select [DBA] -> [Session
Manager] or click the  icon on the toolbar.
The following is the screen layout of the Session Manager.
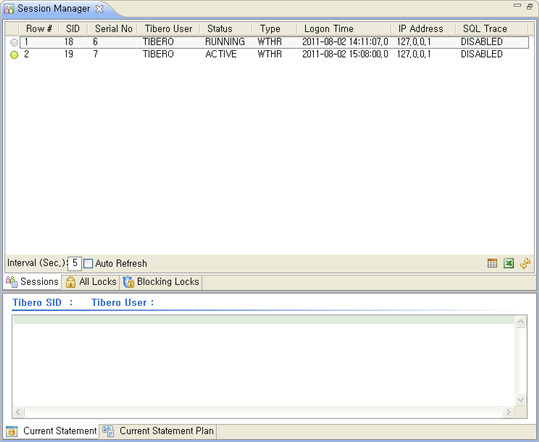
Session Manager consists of two parts; the upper part which displays session information and the lower part which contains a number of tabs . When users click each tab of [Sessions], [All Locks],and [Blocking Locks], the screen of Session Manager displays its relevant content.
The following is the description of icons and additional functions available in the Session Manager screen.
-
Icon
The following is a list of icons shown in the middle of the Session Manager screen.
Icon Description 
Column Filtering 
Excel Output 
Refresh
-
Other Functions
The functions below are located in the middle of the Session Manager screen.
[Sessions] Tab
The following is the screen and columns of the of the [Sessions] tab.
![The Session Manager - [Sessions] Tab](resources/sessions.png)
The following table describes each column in the [Sessions] tab.
| Column | Description |
|---|---|
 | Deactivated Session |
 | Activated Session |
| Row # | Unique number of a row |
| SID | Session ID |
| Serial No | Serial number |
| Tibero User | User ID |
| Status | Activated or deactivated status |
| type | Session type |
| Logon Time | Database access time |
| IP Address | IP Address |
| SQL Trace | Activated or deactivated status of SQL trace |
[All Locks] Tab
The following is the screen and columns of the of the [All Locks] tab.
![The Session Manager - [All Locks] Tab](resources/alllocks.png)
| Column Name | Description |
|---|---|
| Row # | Row ID |
| SID | Session ID |
| Serial No | Serial number |
| Tibero User | User ID |
| Object Name | Object name |
| Lock Type | Lock type |
| Lock Mode | Lock mode |
| State | Lock status |
[Blocking Locks] Tab
The following is the screen and columns of the of the [Blocking Locks] tab.
![The Session Manager - [Blocking Locks] Tab](resources/blockinglocks.png)
| Column Name | Description |
|---|---|
| Row # | Row ID |
| Lock Type | Lock type |
| Hold Mode | Hold type of lock |
| Request Mode | Request mode |
| Blocking Sid | Session ID of the blocked lock |
| Blocking Tibero User | Blocked user ID |
| Waiting Sid | Waiting session ID |
| Waiting Tibero User | Waiting user |
The SQL monitor allows DBAs to monitor SQL
in the Tibero
server. To start the SQL Monitor, either select [DBA] -> [SQL
Monitor] or click the  icon from the toolbar.
The following shows the SQL Monitor view.
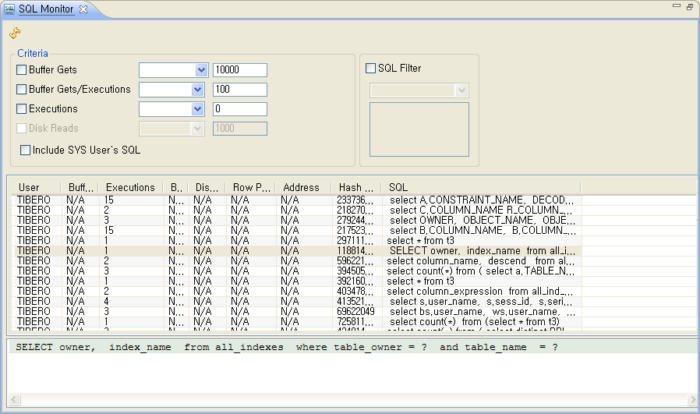
SQL Monitor consists of a criteria section , an SQL filter section , and an SQL detail information section. In the criteria section, users can configure the monitoring condition; in the SQL filter section, users can configure the SQL filter; and in the SQL detail information section, users are given detailed information on SQL.
Each component of SQL Monitor is explained below.
-
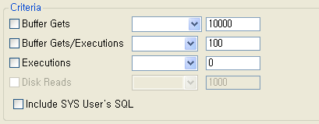
Criteria
The following shows the criteria section of the SQL Monitor.
The following table describes each option of the criteria section.
Option Description Buffer Gets The number of blocks of the buffer accessed Buffer Gets/Executions The number of blocks that are read in a single execution Executions The number of SQL executions Disk Reads The number of Disk I/O Include SYS User's SQL SQL constraint of SYS user
-
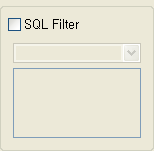
SQL Filter
The following is the SQL filter section of SQL Monitor.
Option Description SQL Filter SQL filter condition Drop Down Menu Type of SQL filter condition Text Box Text to be filtered
-
Detailed Information about SQL
The following table describes each column in the SQL detail information section.
Column Description User User Buffer Gets The number of buffers accessed Executions The number of SQL executions Buffer Gets/Executions The number of blocks that are read in a single execution Disk Reads The number of Disk I/O Row Processed Whether to be processed or not Address Address Hash Value Hash value SQL Corresponding SQL
Transaction Monitor allows DBAs to monitor transactions of the Tibero server.
To start Transaction Monitor, either select [DBA] ->
[Transaction Monitor] or click the  icon from the toolbar.
The following shows the Transaction Monitor screen.
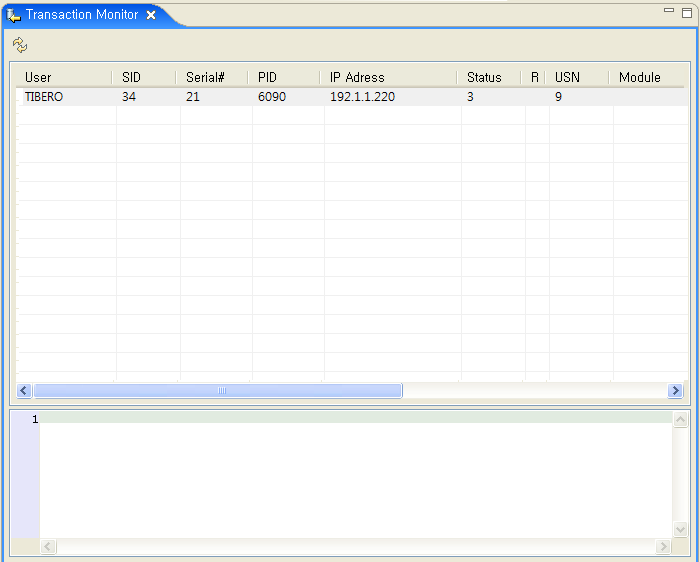
Transaction Monitor consists of the upper part of the screen where users can view transaction information, and the lower part of the screen where users can view detailed information about transactions.
Each component of the Transaction Monitor is explained below.
-
Transaction Information
The following table describes each column in the transaction information section.
Column Name Description User User ID of connected users SID Session ID Serial# Session serial number PID Process ID IP Address IP address Status Transaction status Recursive Recursive call or not USN USN (Undo Segment Number) number Module Module Program Name of the user program Duration The time the transaction took (In seconds) Undo Blocks The block number being used by the transaction Undo Records The record number being used by the transaction Logical IO The number of logical I/O blocks in the process of committing transactions Physical IO The number of physical I/O blocks in the process of committing transactions
-
Transaction Details
This section is used for record transactions. Users can enter comments in the same manner as they do with general text editors.
The Analyze Manager collects statistics for all database objects and analyzes them. DBAs can utilize the data to optimize the performance of the database. For the purpose of internal analysis, the DBMS_STATS package provided by Tibero PSM is used.
To start Analyze Manager, select the [DBA] > [Analyze
Manager] menu or click the  icon from the toolbar. The following shows the
Analyze Manager screen.
icon from the toolbar. The following shows the
Analyze Manager screen.
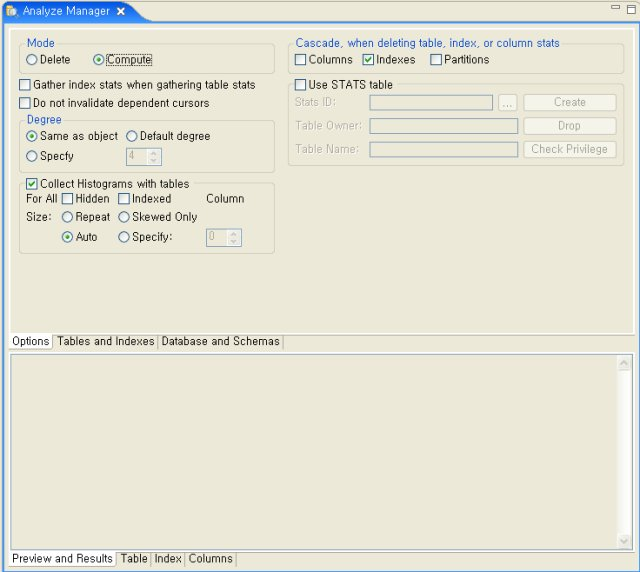
The Analyze Manager consists of the upper part of the screen where users can make analysis requests, and the lower part of the screen where users can view the results of the analysis.
[Options] Tab
The following table describes the Mode option, which is configurable in the [Options] tab of Analyze Manager.
| Column Name | Description |
|---|---|
| Mode | When Compute mode is enabled, an analysis request will be made. When Delete mode is enabled, the collected statistics will be removed. |
Note
Refer to the tbPSM manual for detailed information about each mode.
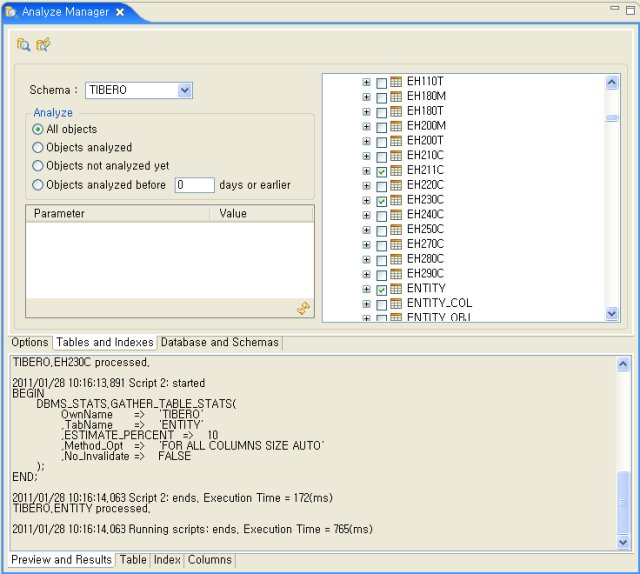
[Tables and Indexes] Tab
In the [Tables and Indexes] and
[Database and Schemas] tabs, users can make an
analysis request or remove the analyzed result. Select the schema to be
analyzed and then select the items from those listed in the tree structure
on the right side of the screen. To enable the analysis, select the
[DBA] > [Analyze Manager] menu or click the
icon from the tool bar.
The following table shows the icons at the top of the Tables and Indexes screen.
| Icon | Description |
|---|---|
 | Requests analysis. |
 | Displays the script for requesting analysis. |
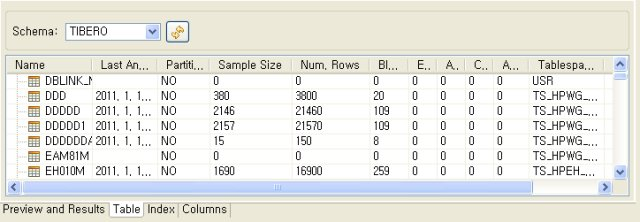
[Database and Schemas] Tab
Users can check the results of the analysis in this tab. Select the schema to be retrieved and click the relevant icon. The results of the analysis will be displayed as shown below.
Graph and Report shows users various statistics used for performance tuning in the graph screen.
To start Graph and Report, select [DBA] -> [Graph and
Report]or click the  icon from the toolbar. The following shows the
Graph and Report screen.
icon from the toolbar. The following shows the
Graph and Report screen.
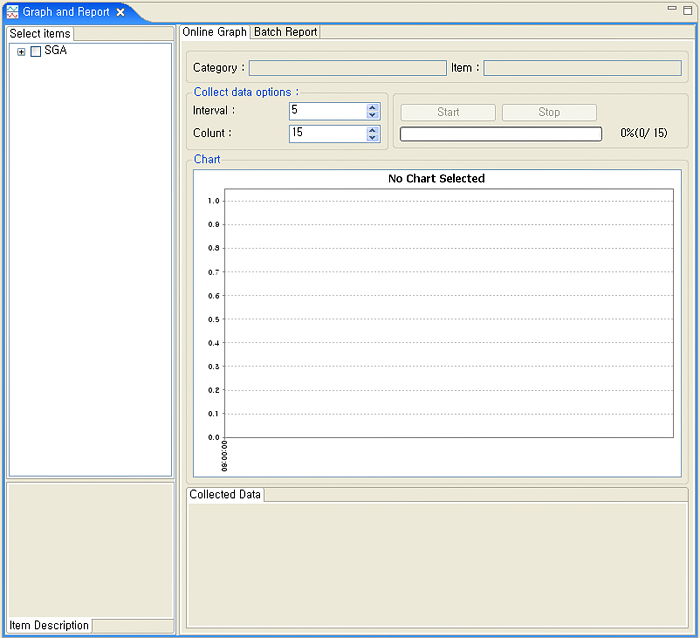
The Graph and Report screen consists of an item selection section and a graph and report section . In the item selection section, users can select statistical information, used for performance tuning, and in the graph and report section, the selected information is displayed as a graph and as a report.
The following table describes statistics used for performance tuning.
| Statistics | Description |
|---|---|
| SGA | SGA (System Global Area) is a memory space which is shared by all processes within a database instance. It consists of a shared pool, DB block buffer, and a log buffer. |
[Online Graph] Tab
To bring up an online graph in the chart area of the [Online Graph] tab, select the desired statistical information from the item selection area, click Interval and Count, and then click the [Start] button.
The following table describes each item in the [Online Graph] tab.
| Item | Description |
|---|---|
| Category | Category information |
| Item | Information on each item |
| Interval | Graph interval |
| Count | The number of total counts |
| [Start] | Starts to display a graph. |
| [Stop] | Stops displaying a graph. |
| Chart | Visualizes statistical information. |
| Collect Data | Displays the collected statistical information |
[Batch Report] Tab
A report can be displayed at a desired path and time.
The following is the screen and items of the of the [Batch Report] tab.
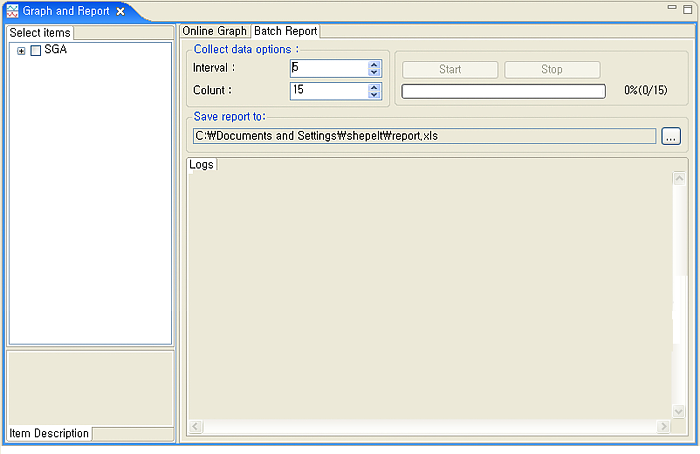
The following table describes each item in the [Batch Report] tab.
| Item | Description |
|---|---|
| Interval | Specifies an interval to collect data. |
| Count | Specifies the number of total counts. |
| [Start] | Starts to display a report. |
| [Stop] | Stops displaying a report. |
| Save report to: | Specifies a path to save a report. |
| Logs | Displays log information. |
The Parameter Manager shows the parameter information of the connected database and allows the DBA to modify it.
To start the Parameter Manager, select [DBA] -> [Parameter
Manager] or click the  icon from the toolbar. The following shows the
Parameter Manager screen.
icon from the toolbar. The following shows the
Parameter Manager screen.
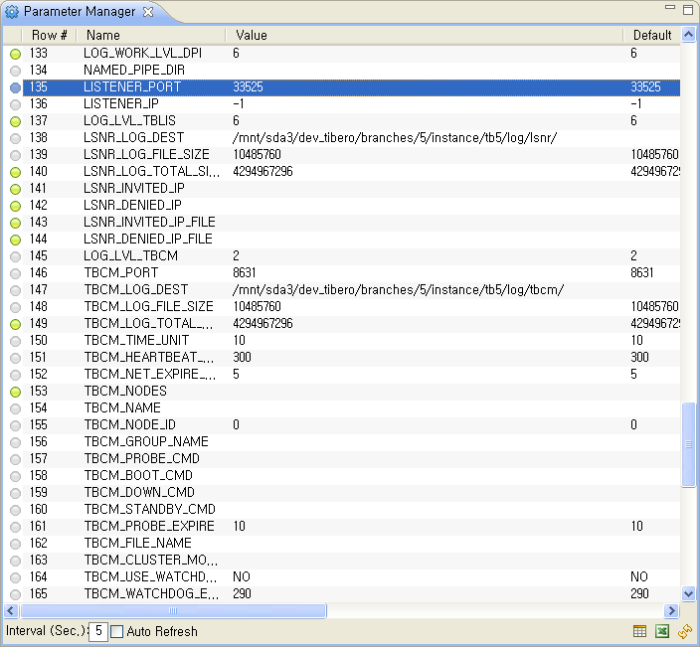
The components of the Parameter Manager screen are explained below.
-
Other functions
The following table describes additional functions of the Parameter Manager. They are located on the bottom left of the Parameter Manager screen.
To edit, right click a parameter and the [Editor Parameter Value] and [Refresh] menus will be displayed. If the [Editor Parameter Value] menu is selected, the InitParam Value Change dialog box will appear. Parameters can be edited in the dialog box.
For example, DBMS_LOG_DEST parameter will appear as shown below.
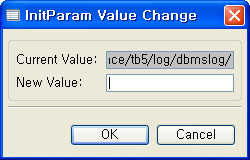
The following table describes each item in the InitParam Value Change dialog box.
| Function | Description |
|---|---|
| Current Value | Shows the current value set in the parameter. |
| New Value | Specifies the new value for the parameter. |
The Extents Viewer shows the location and size of the extent. An Extent is a logical unit used to save data in a database.
To start the Extents Viewer, select the
[DBA] -> [Extents Viewer] menu or click the
 icon from the toolbar. The following shows the
Extents Viewer screen.
icon from the toolbar. The following shows the
Extents Viewer screen.
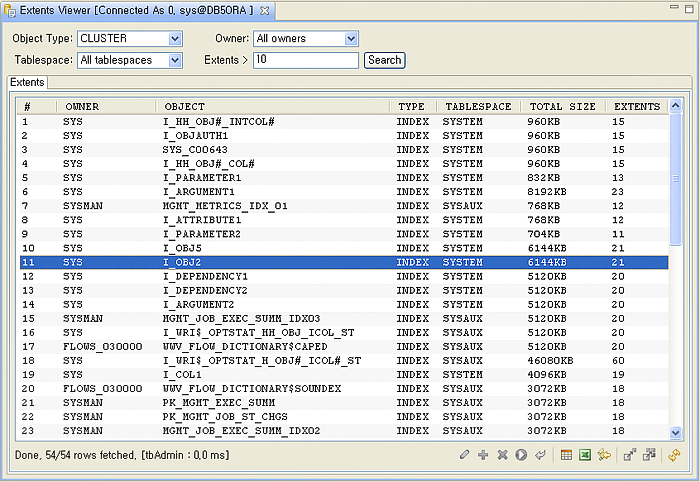
Extents Viewer consists of a search condition section and a search result section . In the search condition section, users can search extent information and in the search result section, the search results are displayed.
The components of the Extents Viewer screen are explained below.


-
Search Condition
The following table describes the search conditions of the Extents Viewer.
Search Condition Description Object Type All Object, CLUSTER, INDEX, INDEX SUBPARTITION, LOBINDEX, LOBINDEX SUBPARTITION, TABLE, TABLE SUBPARTITION, UNDO Owner Owner Tablespace Tablespace Extents Extent -
Search Result
The following table describes the search results as displayed in the Extents Viewer.
Search Condition Description Owner Owner Object Extent object Type Type of schema object Tablespace Tablespace Total Size Total size of schema object Extents The number of extents
Database Information allows DBAs to view the status of physical resources of the connected tbAdmin.
To start Database Information, select [DBA] -> [Database
Information] or click the  icon from the toolbar. The following shows the
Database Information screen.
icon from the toolbar. The following shows the
Database Information screen.
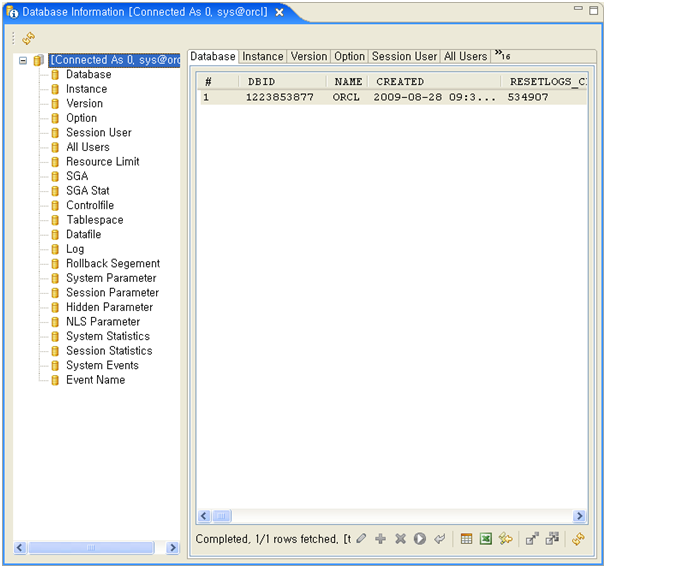
Database Information consists of a tree View section on the top left of the screen and inquiry result section on the right portion of the screen.
In the tree view section, users can view physical resources of the database, and the inquiry result section displays information about resources.
Note
The items and tabs shown in the search result section differ according to the connected database (Tibero, Oracle) and the product version.
Descriptions of icons at the bottom of the Database Information screen are the same as those in the “4.8. Extents Viewer”.
The Tablespace Manager allows DBAs to view tablespace information about the connected tbAdmin, and create, modify, or delete each tablespace.
To start Tablespace Manager, select the [DBA] -> [Tablespace
Manager] menu or click the  icon from the toolbar.
The following shows the Tablespace Manager screen.
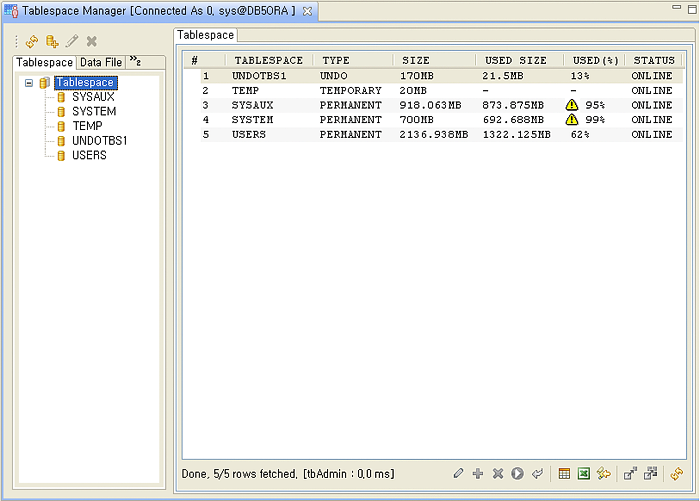
The Tablespace Manager consists of a tree view section on the top left of the screen and a detailed information section on the right of the screen. The tree view section shows the tablesapces of the database and in the detailed information section, users can view information about tablespaces.
Note
The icons at the bottom of the Tablespace Manager screen are same as those in the “4.8. Extents Viewer”.
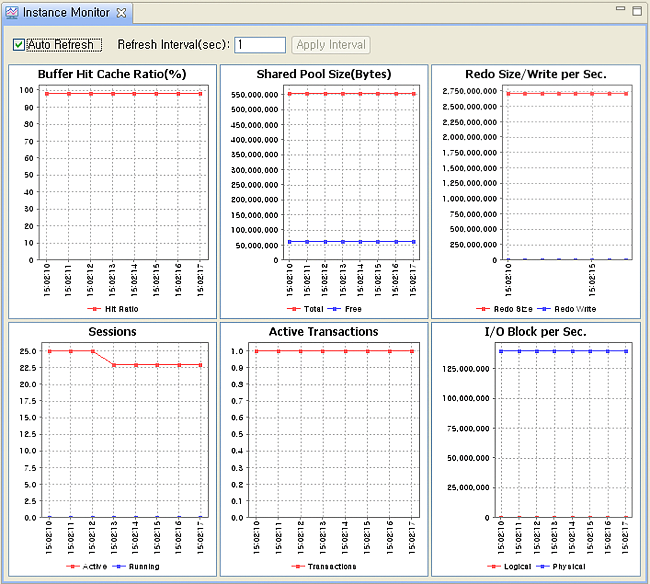
The Instance Monitor dialog box allows DBAs to monitor the status of database instances, in real time.
To start the Instance Monitor, select [DBA] -> [Instance
Monitor] or click the  icon from the toolbar.
The following shows the Instance Monitor screen.
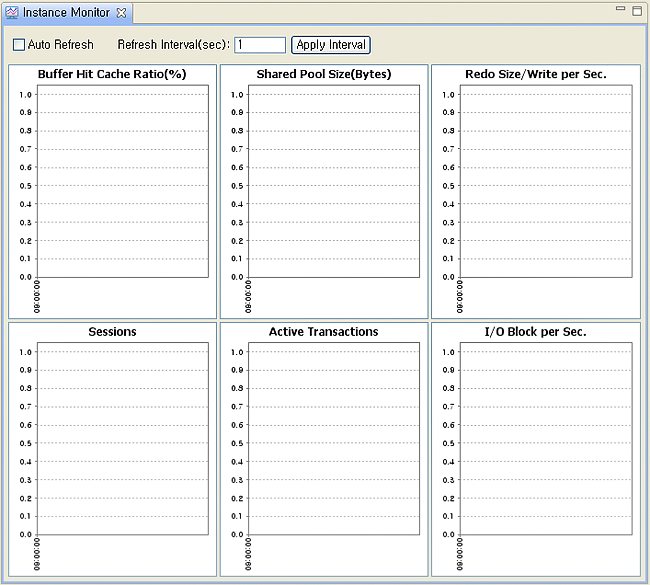
The Instance Monitor consists of an option section where users can configure the operating method and the interval, and the lower part which displays monitoring results as graphs.
The following table describes the functions of the Instance Monitor.
| Function | Description |
|---|---|
| Auto Refresh | Enables the Instance Monitor, and automatically refreshes it. |
| Refresh Interval(sec) | Updates and displays the graph at every interval specified in Refresh Interval(sec). |
The following is an example of the Instance Monitor after its functions were executed.
 |
The Compile Invalid Objects dialog box allows DBAs to compile invalid objects in batch mode.
To start the Compile Invalid Objects dialog, select [DBA] -> [Compile Invalid Objects].
The following shows the Compile Invalid Objects dialog box.
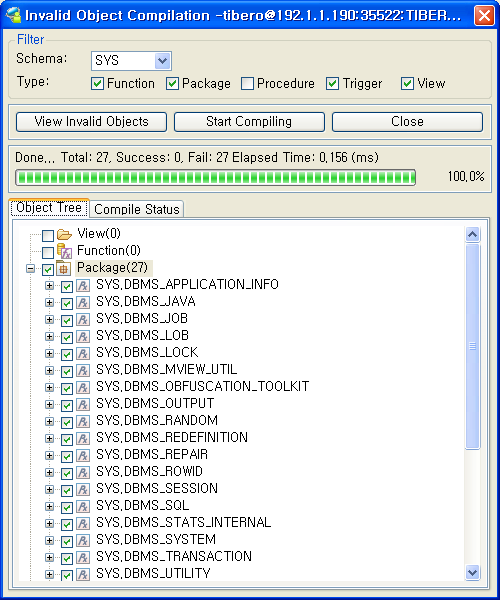
The Compile Invalid Objects dialog box consists of a Filter section, an [Object Tree] tab , and a [Compile Status] tab . The [Object Tree] tab displays the status of processes in the status bar and a list of valid objects are displayed in the tree. The [Compile Status] tab is enabled when the [Start Compiling] button is clicked.
The components of the Compile Invalid Objects dialog are described below.
-
Filter
The following table describes each item in the Filter section.
Item Description Schema The schema to be compiled Type The type of the target to be compiled
-
Button
The following table describes each button in the Compile Invalid Objects dialog box.
Button Description 
Updates information about valid objects 
Compiles all the selected objects at once 
Closes the Compile Invalid Objects dialog box
Follow the procedure below to use the Compile Invalid Objects dialog.
-
Select the schema to be compiled.
-
Select the type of the target to be compiled.
-
Click the [View Invalid Objects] button to update the contents in the [Object Tree] tab.
-
Select an object from the [Object Tree] tab and click the [Start Compile] button.
-
Click the [Compile Status] tab to display the compiled result.
Security Manager allows DBAs to retrieve all security related issues of a database including user, role, authentication, and profile, and change and configure them in real time. To start Security Manager, select [DBA] -> [Security Manager].
The following shows the Security Manager screen.
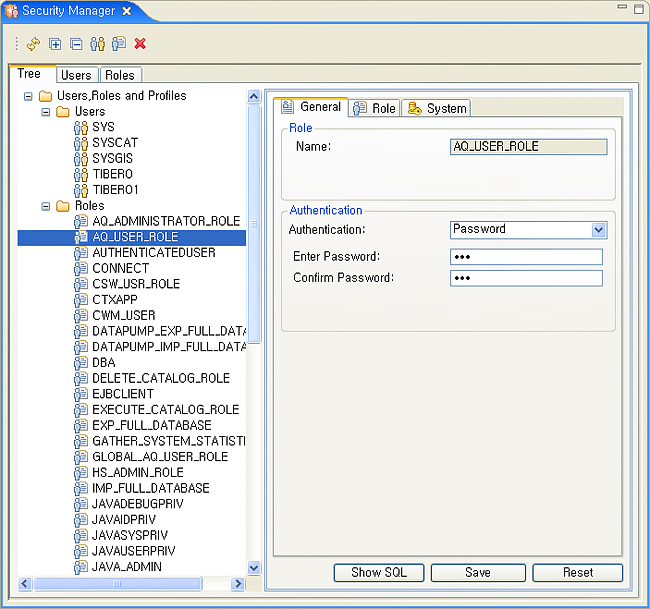
The Security Manager consists of a tree section on the left side of the screen and a detailed information section on the right side of the screen . The tree section displays security objects and the detailed information section displays information about each security object.
Tree
The tree section allows DBAs to retrieve a list of users and roles from the connected database, and modify information about each object.
-
Users
Authentication method, default tablespace, lock status, role, and system privilege are managed in this section.
Item Description Name User name Default Tablespace Default tablespace Created Date User creation date Status User status Locked Date User locking date Expired Date User expiration date
-
Roles
Authentication method, role, and system privilege are managed.
Item Description Name Role name Password Required Whether a password has been authenticated Authentication The method of authenticating a password
[General] Tab
The following is the [General] tab which displays general information about an object.
![The Security Manager - [General] Tab](resources/sec_role_01.png)
| Item | Description |
|---|---|
| Name | Displays the name of the object |
| Authentication | Specifies authentication method and password |
| Tablespace | Specifies a default tablespace |
| Status | Displays the status of the object |
[Role] Tab
The following is the [Role] tab which displays roles configured in the object.
Roles can be checked in the Role section, and selected roles can be added or deleted by clicking [Down] or [Up] in the Granted Roles section.
![The Security Manager - [Role] Tab](resources/sec_role_02.png)
[System] Tab
The following is the [Role] tab which displays the system privileges that can be configured in the object.
System privileges can be checked in the System privileges section, and selected system privileges can be added or deleted by clicking [Down] or [Up] in the Granted Privilege section.
![The Security Manager - [System] Tab](resources/sec_role_03.png)
Users can export the structure and data of the database using tbAdmin, or enter data by importing exported data and creating a database structure. In addition, retrieved data can be exported to an excel file and the exported excel files can be imported to a table.
Data is exported through a GUI by calling ExpImp. To start Export, click [Tool] -> [Export].
The following shows the Export screen.
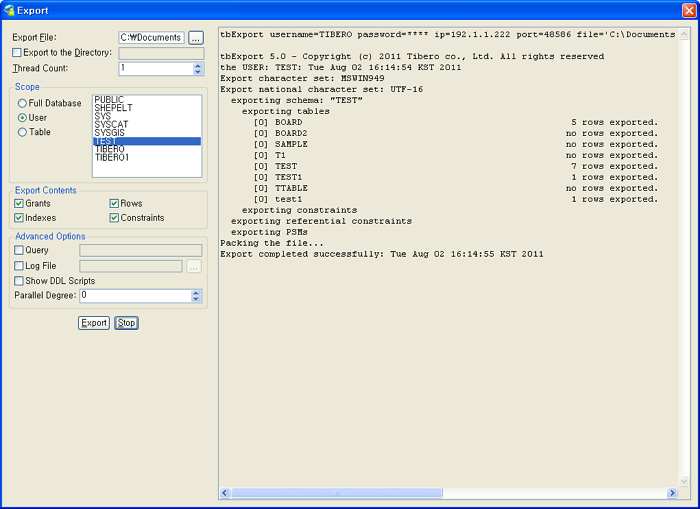
The Export Screen consists of a configuration section on the left side of the screen and a console section on the right side of the screen.
The following table describes each item in the Export screen.
| Item | Description |
|---|---|
| Export File | Specifies a path to the file containing export results. |
| Export Directory (Unpacked Files) | Specifies a path to the uncompressed directory. |
| Thread Count | Specifies the thread count to be used to execute the Export. |
| Scope |
|
| Export Contents |
|
| Advanced Options |
|
Note
Refer to “4.15. ExpImp” for the detailed information about the Export option.
The Import option below provides a GUI interface used to call ExpImp, to import files. To start Import, click [Tool] -> [Import].
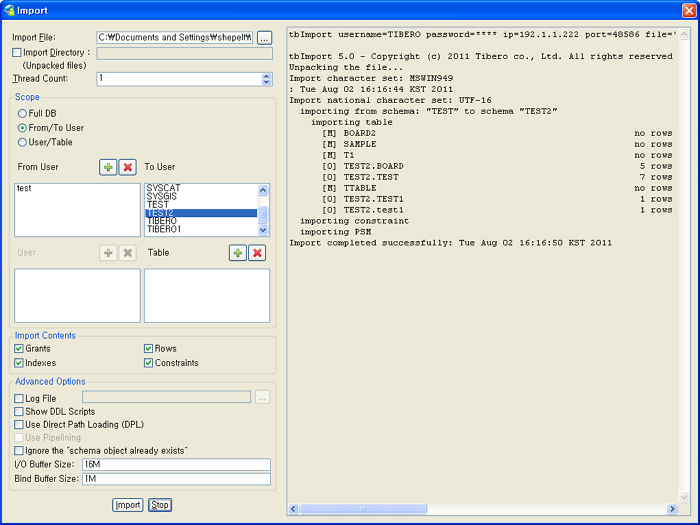
The Import option consists of the configuration section on the left side of the screen, and the console screen section on the right side of the screen.
The following table describes each configurable item in the Import screen.
| Item | Description |
|---|---|
| Import File | Specifies the path of the file to be imported. |
| Import Directory | Specifies the path of the uncompressed file to be imported. |
| Thread Count | Specifies thread count to be used to execute the Import. |
| Scope |
|
| Import Contents |
|
| Advanced Options |
|
Note
Refer to “4.15. ExpImp” for the detailed information about the Import options.
The Explmp option allows DBAs to extract or input data in a database table. To start ExpImp, click [Tool] -> [ExpImp]. The ExpImp consists of the [Options], [Imp], and [Exp] tabs.
[Options] Tab
Specifies options in the Explmp.
The following shows the screen and items in the [Options] tab.
![ExpImp - [Options] Tab](resources/expimp_options.png)
| Item | Description |
|---|---|
| Use Excel File | Specifies whether to use Excel. |
| Field Delimiter | Specifies a delimiter to use to distinguish each field. |
| Field Qualifier | Specifies a qualifier for each field. |
| Record Delimiter | Specifies a delimiter to use to distinguish each record. |
| Default Date Format | Specifies a default date format. |
| Commit Size | Specifies the number of records to be inserted before executing commit. |
[Exp] Tab
This option allows DBAs to extract data to Excel files. A condition clause can be added in the created query.
The following shows the screen and items in the [Export] tab.
![ExpImp - [Export]](resources/tbadmin_expimp_exp.jpg)
| Item | Description |
|---|---|
| Table | Selects the item to be exported. |
| SQL Query | Edits the SQL query which will process Export. |
| File | Specifies the path to the Excel file where the Export result will be saved. |
| Include Header Line | Specifies whether to include column names in the Excel file. |
[Imp] Tab
This option allows DBAs to read an Excel file and input data into a table.
The following shows the screen and items in the [Import] tab.
[Figure 4.29] ExpImp - [Import] Tab
![ExpImp - [Import] Tab](resources/tbadmin_expimp_imp.jpg)
| Item | Description |
|---|---|
| Source file | Specifies a path to the Excel file to be imported. |
| Destination table | Selects a table to insert data from an Excel file. |
| Truncate before an import | Specifies whether to delete the content in the existing table. |
| Ignore the first line | Specifies whether to ignore the first line in the Excel file. |
| Batch Execution | Specifies whether to perform the import process in batch mode. |
| Status / Log | Shows the import status and the log. |